
Infographics & Data Visualization
Complex information doesn’t have to feel overwhelming. I design infographics and data visualizations that make information clear, engaging, and accessible across platforms, from community impact reports to health alerts.
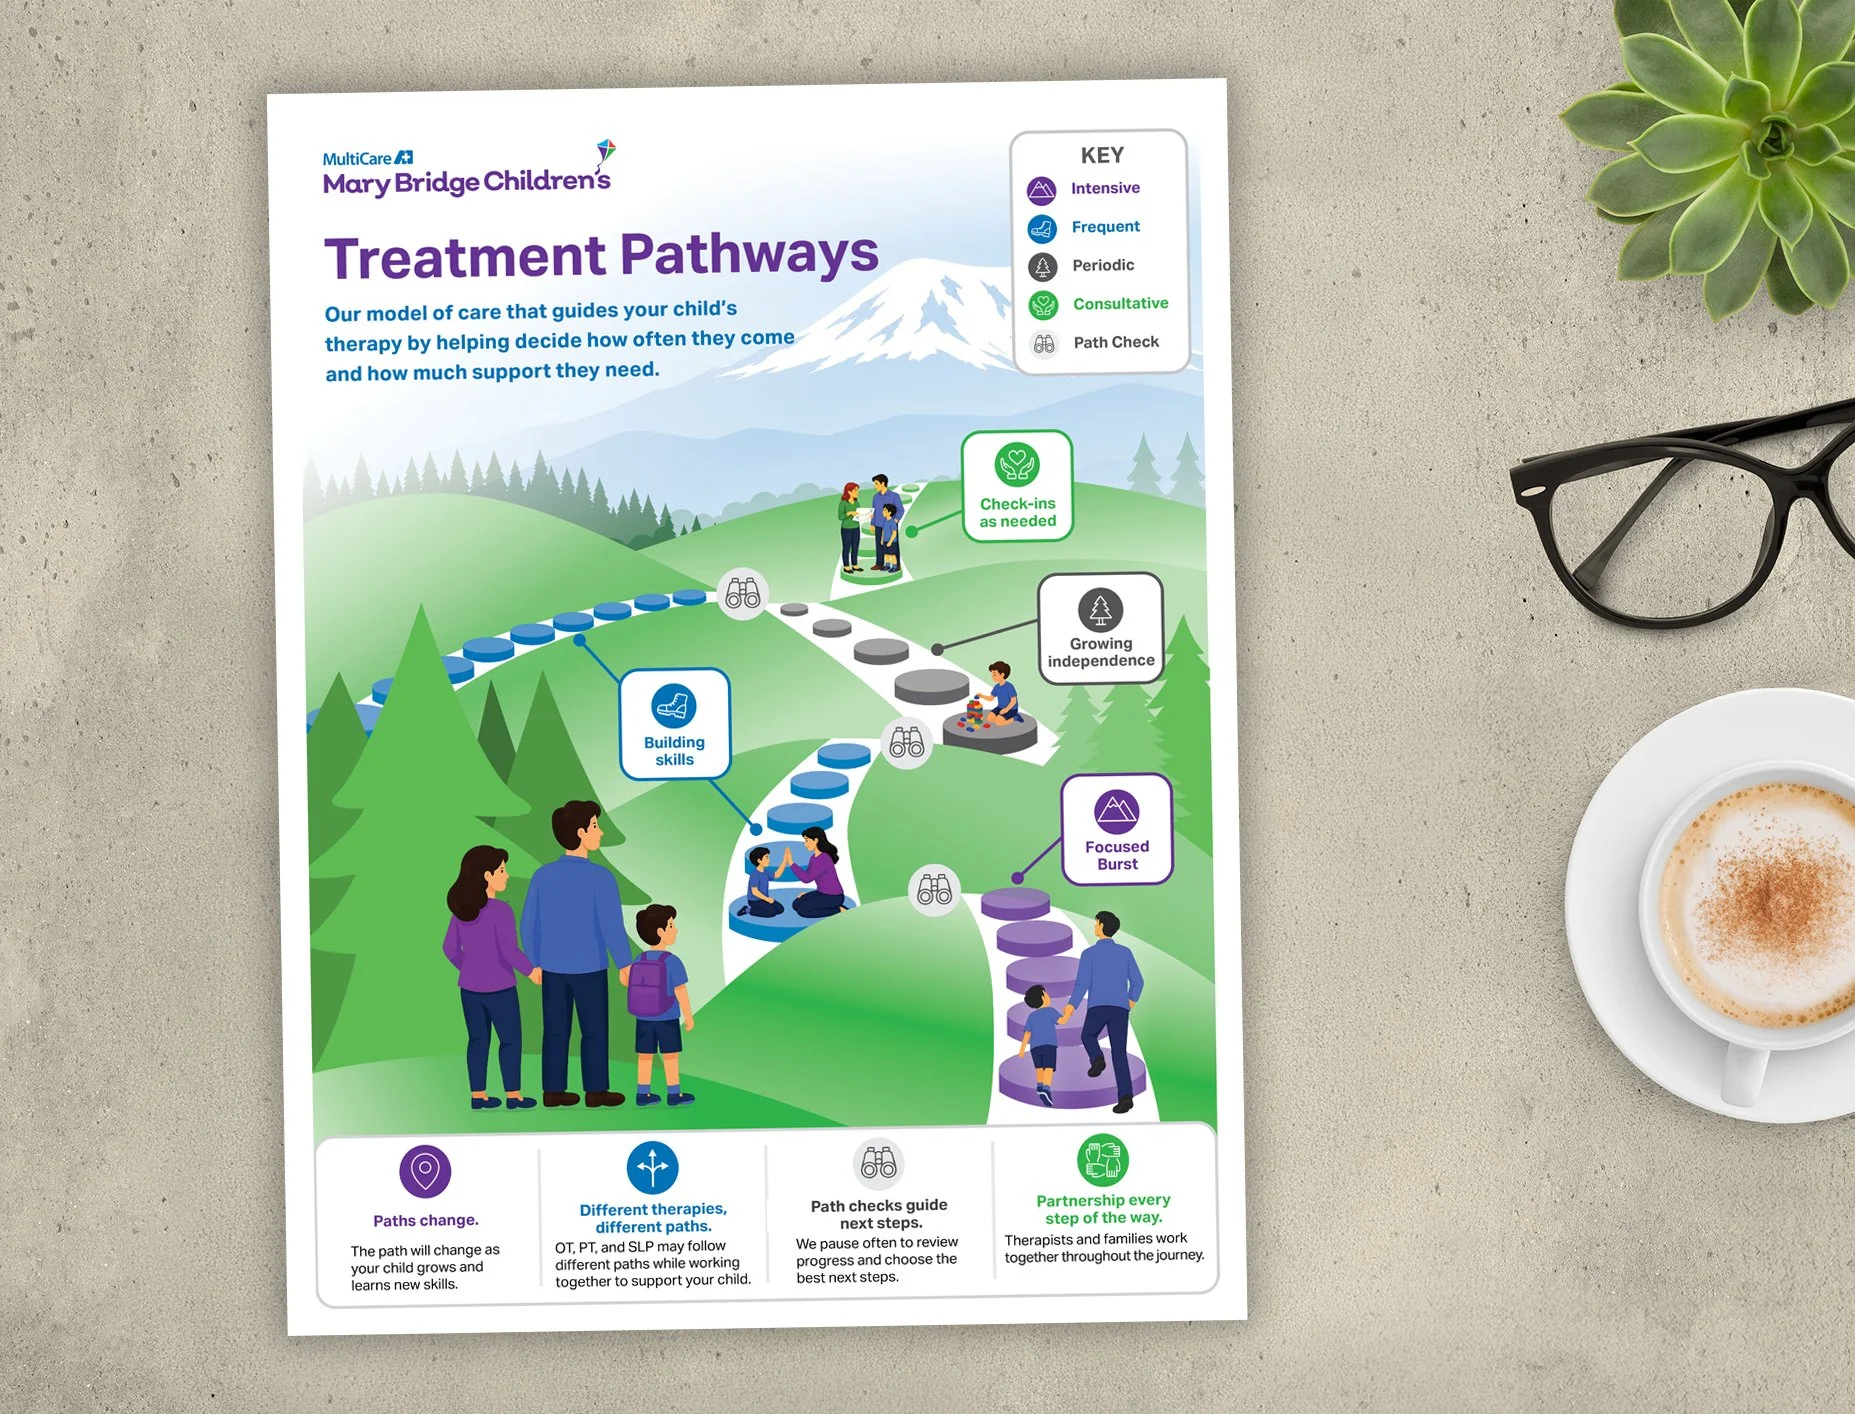
Treatment Pathways
Information Design | Illustration | Layout
The challenge:
Help families understand a complex pediatric therapy model by illustrating different treatment pathways, levels of support, and entry points in a way that feels clear, encouraging, and consistent with Mary Bridge Children's Hospital's brand.
My solution:
I designed a custom Pacific Northwest-inspired hiking metaphor that reflects Mary Bridge's playful illustration style while communicating varying levels of support, multiple entry points, and the flexibility for children to move between pathways as their needs evolve. Through custom illustration, information hierarchy, and iconography, the infographic transforms a complex clinical care model into an approachable visual guide for families.
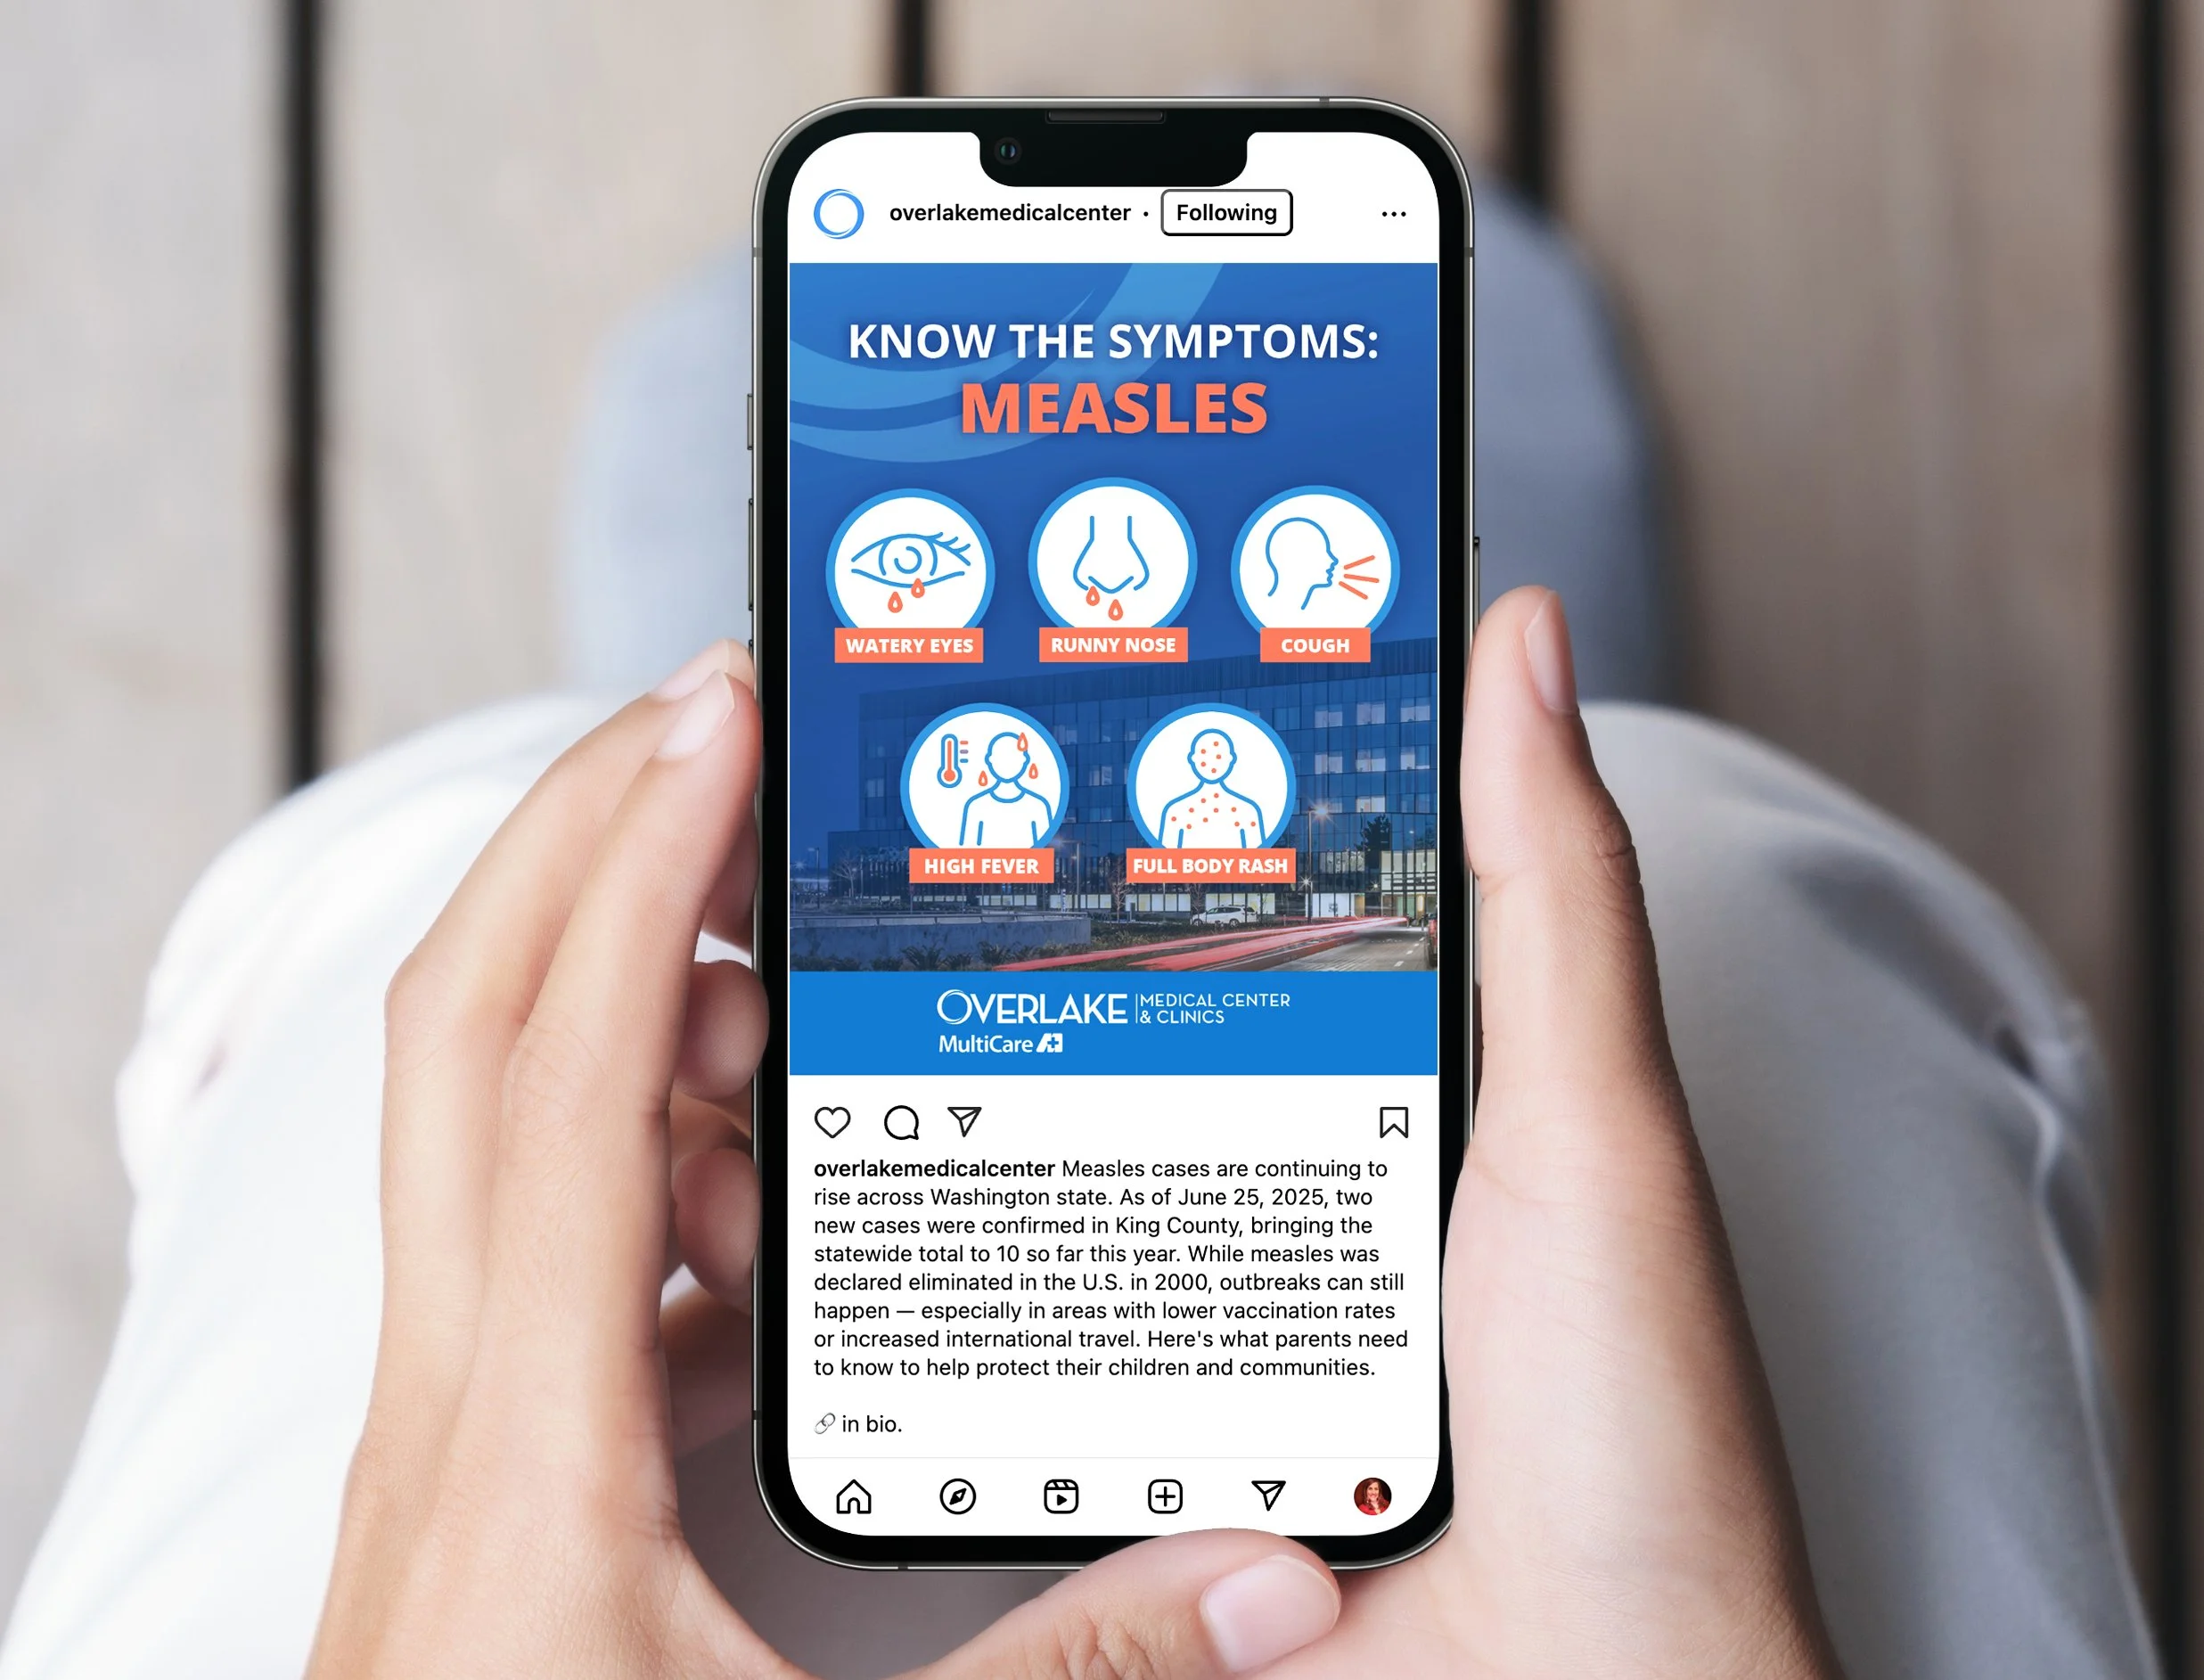

Know the Symptoms
Social Graphics | Illustration | Layout
The challenge:
Raise awareness of serious health threats, such as measles and sepsis, through graphics that stand out in busy digital feeds—communicating urgency with clarity and care.
My solution:
I designed a series of bold social posts that pair custom illustrations with hospital imagery, optimized for mobile viewing and quick readability. Each graphic surfaces essential symptoms at a glance, using a clear, measured tone that helps audiences recognize warning signs and seek timely care.

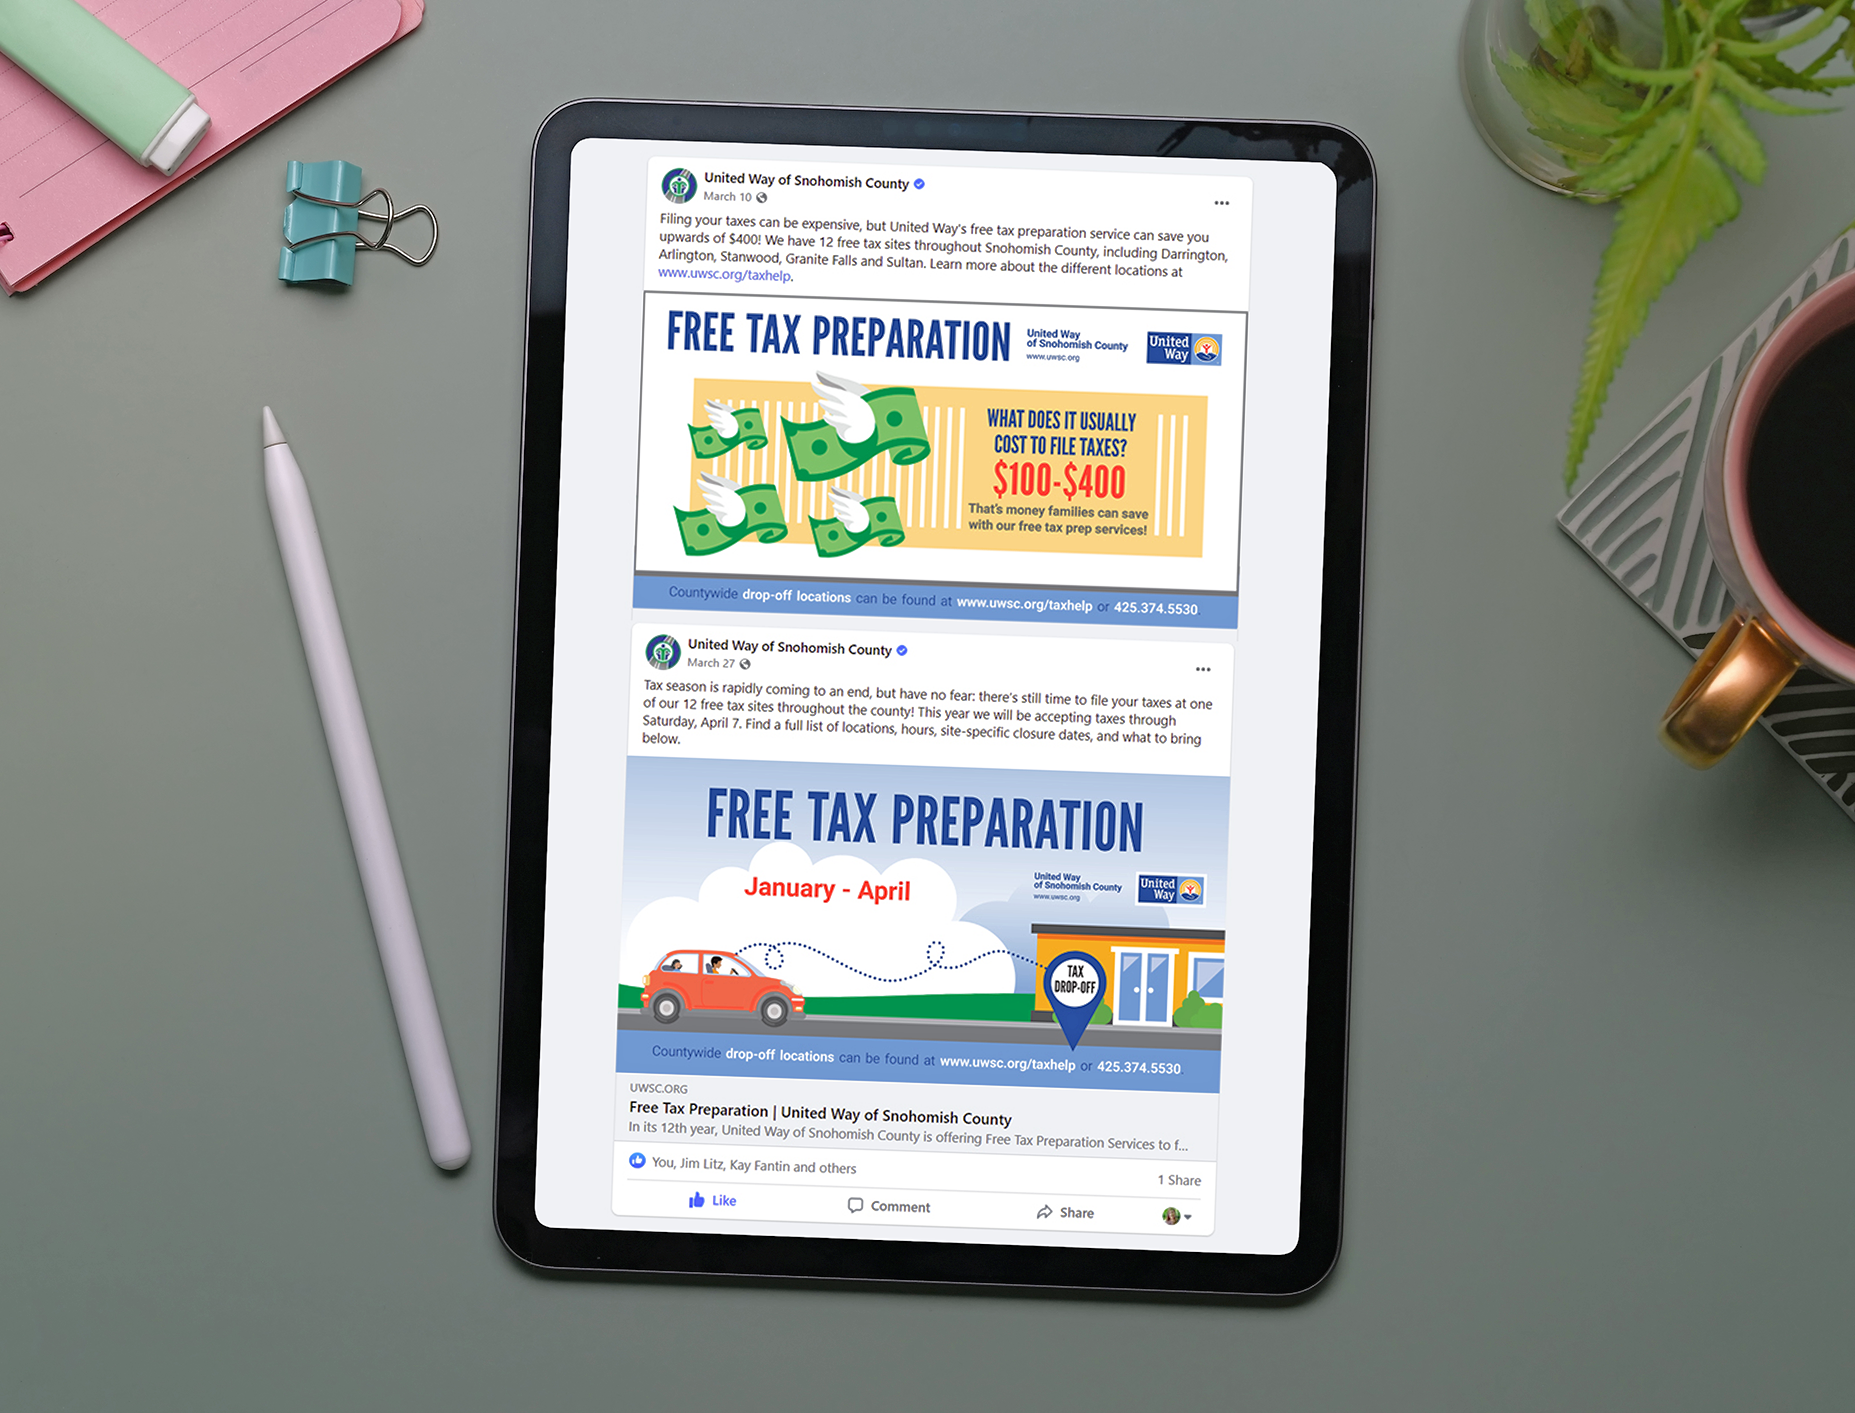
Free Tax Preparation Campaign
Social Graphics | Illustration | Layout
The challenge:
Show the community benefit of a free tax preparation program in a way that can be shared clearly and consistently across a range of digital formats.
My solution:
I designed a clean, flexible infographic series that highlights the benefits of free tax preparation services and encourages more families to access the program. A modular structure supports sharing individual graphics or the full series across web, social, and presentation platforms—extending reach and long-term utility.
The campaign contributed to a community-wide impact of $45 million in refunds returned and $4.5 million in filing fees saved.