
Case Study
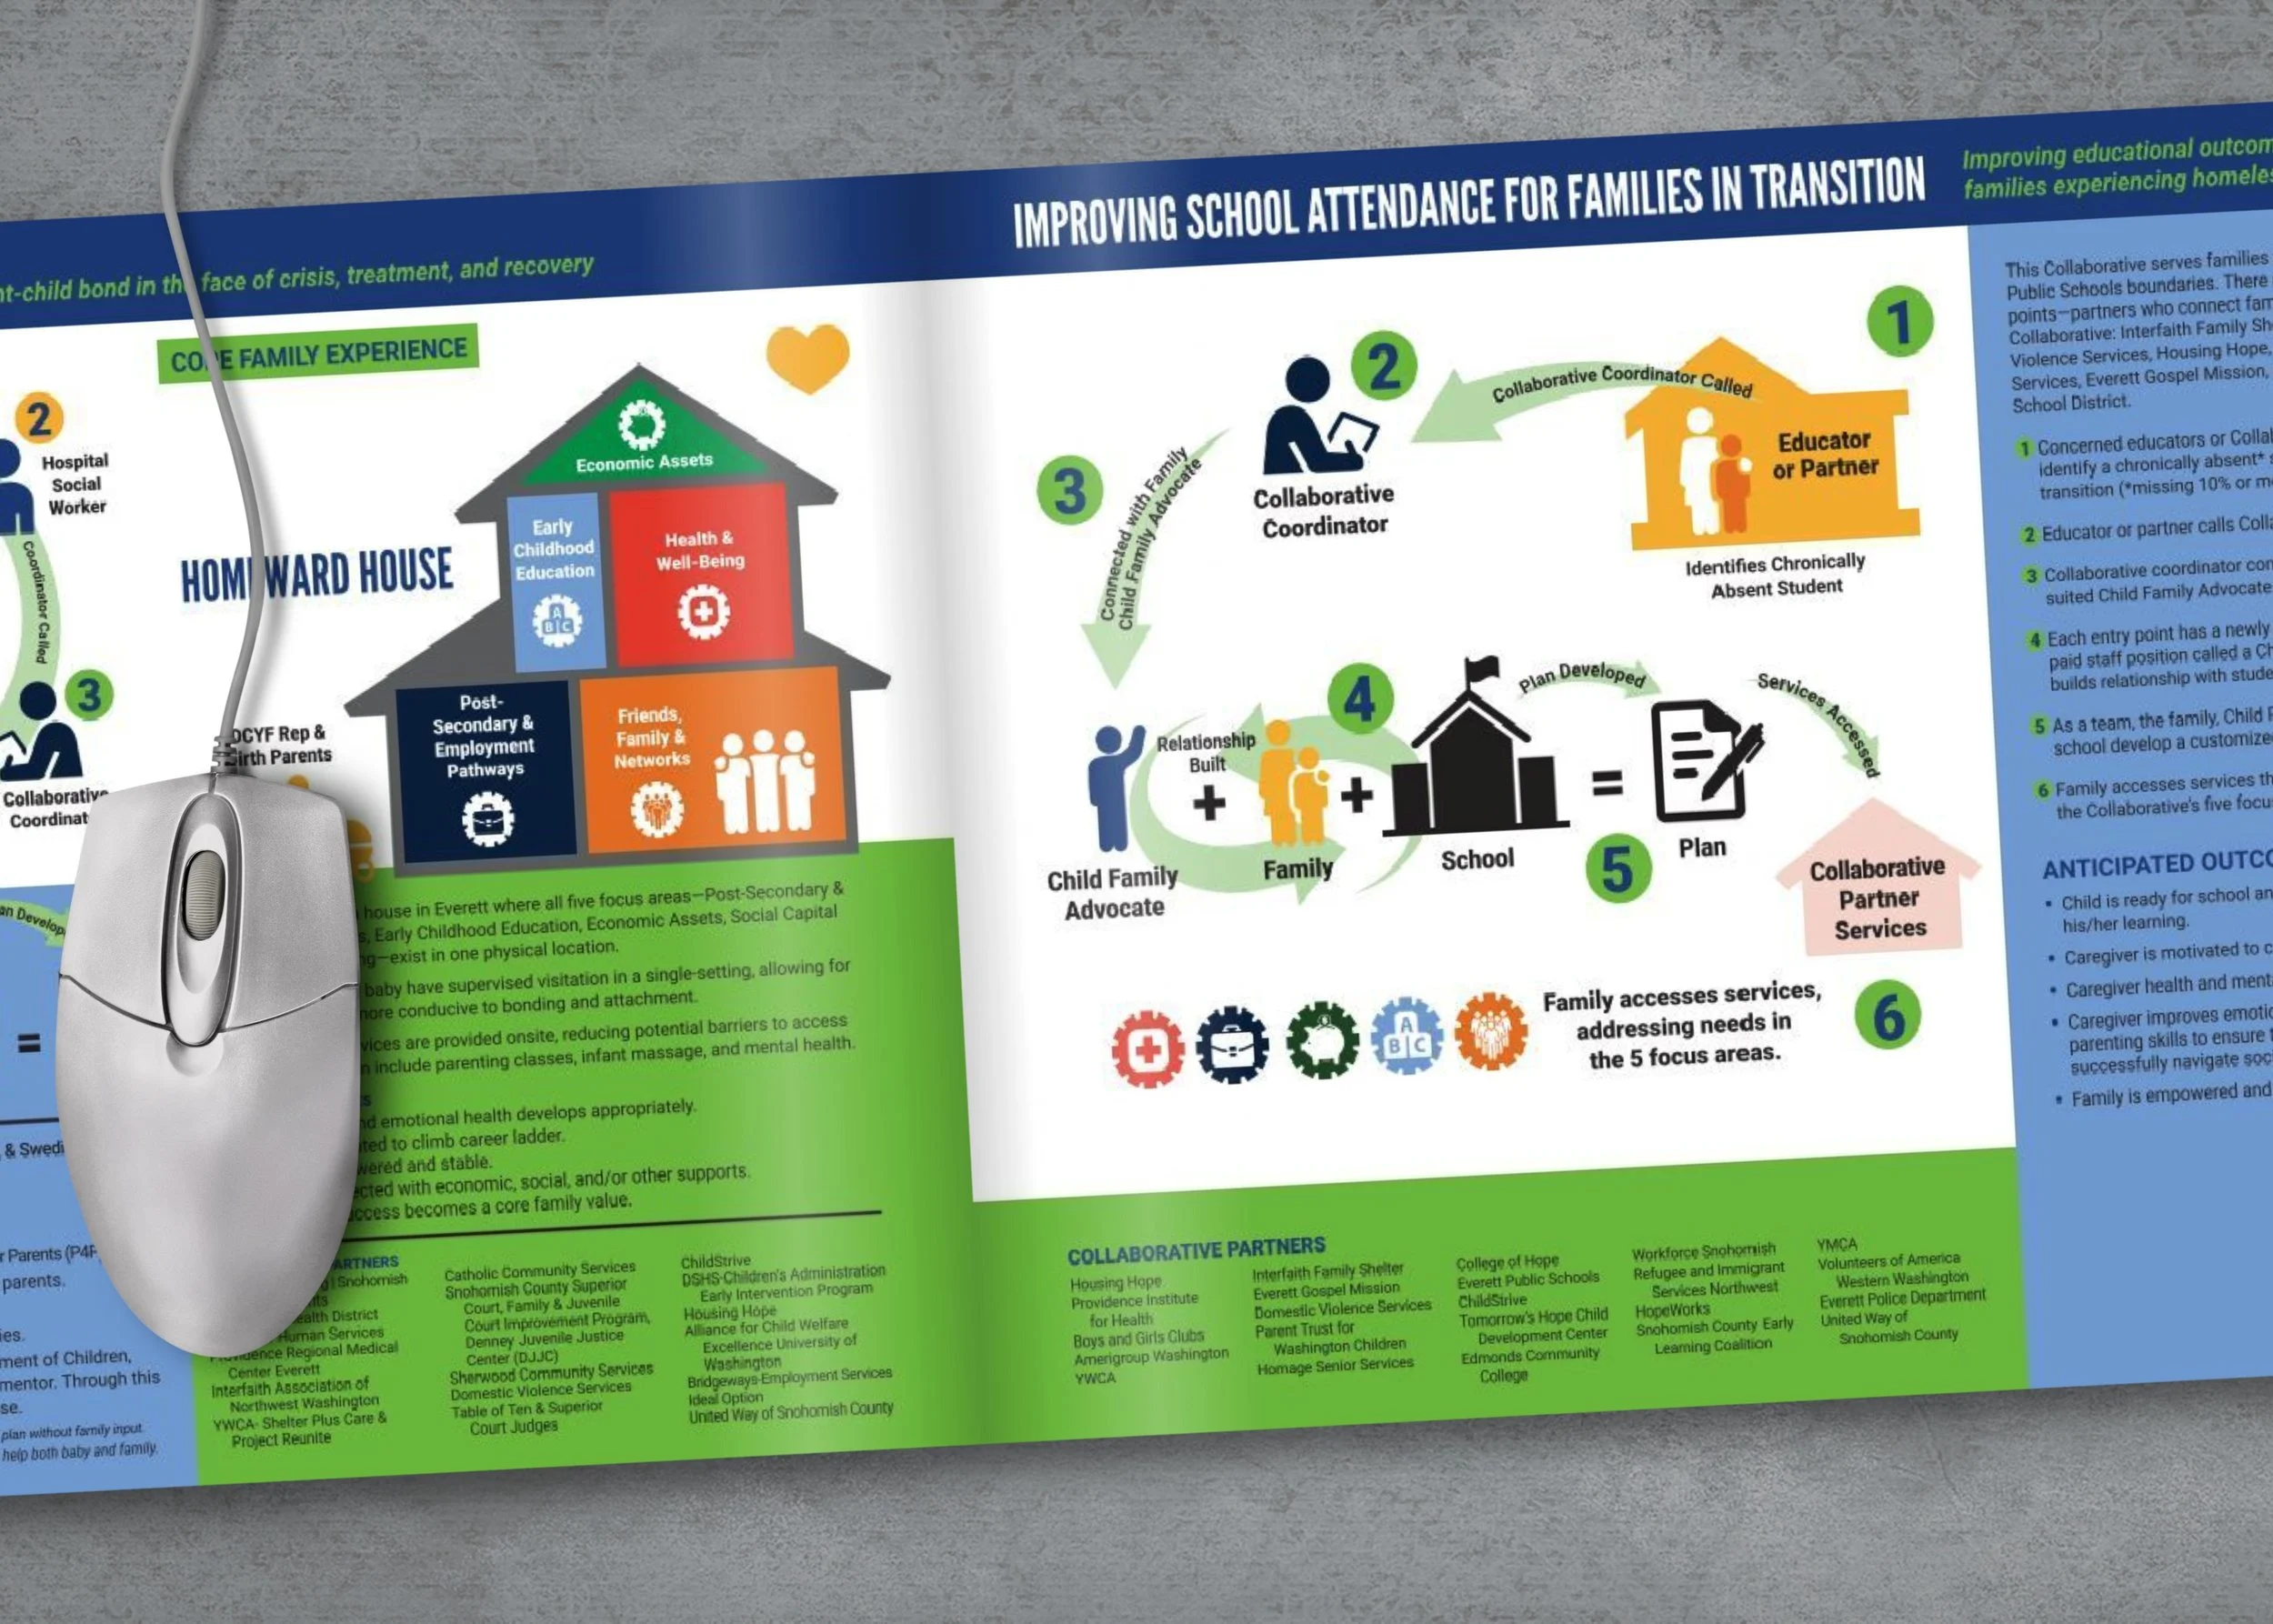
Improving School Attendance for Families in Transition Collaborative Model Diagram
When United Way of Snohomish County launched CORE: Creating Open Roads to Equity, nothing like it had been done before. CORE brought together cross-sector partners to provide holistic support and tackle systemic barriers that keep families trapped in poverty. This systems-change work set United Way apart from others working on poverty in the region.
But systems change is slow and complex. With few early success stories, United Way needed a way to explain its groundbreaking model. The Marketing and Communications Team created “Collaborative Model Diagrams” for each CORE Collaborative, or infographics showing how partners worked together to support families. I designed one for each of the five Collaboratives, first featured in their annual report and later used by Collaboratives to explain and pitch their work.
Here’s the design process for the Improving School Attendance for Families in Transition (ISA) Collaborative, which helps ensure kids experiencing homelessness are not chronically absent from school.
-

Sketch 1
The Director of Marketing & Communications and I met with the Program Team to map how ISA’s approach differs from traditional responses to chronic absence. Together, we sketched the collaborative process with pencil and paper.
-

Sketch 2
In reviewing the first sketch, we realized audiences might think the Everett School District was the only entry point for families. The sketch also suggested families were passive recipients, rather than active participants. Programs revised it to include multiple entry points, seven Child Family Advocates, and two-way communication arrows.
-

Draft 1
To test clarity, I created a first draft in InDesign. I customized icons, incorporated text from the Program Team, and laid out the process visually. This version went directly to ISA for feedback.
Final
Feedback showed the draft was overcomplicated with too many arrows, shapes, and geographic details. We simplified to emphasize what mattered most: the family’s journey, the relationships built, and the creation of success plans. Supplemental text captured details that didn’t belong in the illustration itself.
The redesigned version was more digestible and aligned with the series of Collaborative Model Diagrams in the annual report. It continued to evolve through twice-yearly updates as ISA’s model developed.
Reflection
This project was a reminder that design is iterative. Sometimes you have to explore a busy, complex draft before you can see what’s working, cut away what’s not, and land on a clear, effective solution.